

Global efforts in health education advocated lowering serum cholesterol levels according to the ‘lower the levels, the better the outcome’ motto, aiming to reduce atherosclerosis and cardiovascular disease (CVD) [1]. These efforts have been supported by evidence from epidemiologic studies linking elevated cholesterol levels to increased CVD risk [2–4] and clinical trials demonstrating that statin therapy reduces CVD events and mortality proportionally to the degree of low-density lipoprotein cholesterol (LDL-C) lowering [5–7]. However, these trials predominantly focused on high-risk populations, leaving the relationship between cholesterol levels and all-cause mortality in the general population unresolved [8].
Early observational studies in the 1980s reported counterintuitive inverse associations between cholesterol and mortality, but methodological limitations, such as unaddressed confounding, led the National Institutes of Health to dismiss these findings in a 1990 consensus conference [9]. Subsequent studies incorporated stricter adjustments for confounders but were largely limited to elderly cohorts, raising concerns about generalisability [10–14]. Some studies in broader populations have yielded inconsistent results, with reports of positive (i.e. ‘the lower the better’) [15,16], inverse (i.e. low cholesterol was a risk factor for mortality but not high cholesterol) [17–22], or U-shaped (i.e. both low and high cholesterol were harmful) [23–30] association between cholesterol levels and mortality. While recent meta-analyses and regional East Asian longitudinal studies have investigated the association between lipid levels and mortality, these investigations have predominantly focused on elderly populations (aged ≥60 years) [31,32]. The impact of low cholesterol across the full adult life course, particularly in younger general populations, remains underexplored. Furthermore, evidence of cause-specific mortality remains sparse.
To address these inconsistencies and gaps, we evaluated the associations of LDL-C and total cholesterol (TC) with all-cause and cause-specific mortality in a large prospective East Asian population cohort of over 370 000 individuals. We provided critical insights into the nuanced risks of low cholesterol levels, particularly in understudied East Asian demographics.
METHODS
Study design and data collection
The Taiwan MJ Cohort is based on a comprehensive database and biorepository of >500 000 individuals who participated in a health screening programme in Taiwan organised by the MJ Group, the largest health management institution in Asia. We included adults aged ≥20 years who participated in the programme between 1996 and 2010 [33]. Each participant completed a self-administered questionnaire, including questions on medical history and lifestyle factors, underwent a comprehensive physical exam, and had blood drawn. We excluded participants who had a follow-up period shorter than one year (n = 371), lacked both baseline LDL-C and TC measurements (n = 1358), and those missing any covariate data (n = 127 969). Consequently, we included a total of 374 354 participants.
We determined the end of the follow-up period by the latest available linkage to the death registry. This yielded a median follow-up of 10.0 years, providing an adequate temporal window to assess long-term mortality trends while permitting sensitivity analyses, such as excluding deaths within the first five years, to address potential reverse causality and occult disease latency. We performed a retrospective power analysis to evaluate the statistical adequacy of the samples. Based on the observed hazard ratio (HR) of 1.24 for low LDL-C and the cumulative event rate, we calculated a required sample size of approximately 23 321 to achieve 80% power (α = 0.05). With a final analytical cohort of 374 354 participants, we achieved >99% statistical power, ensuring robust precision in estimating mortality risks. We followed the STROBE guidelines (Checklist S1 in the Online Supplementary Document) [34].
Covariate assessment
Overnight fasting blood was analysed under standardised protocols using the Hitachi 7150 Autoanalyzer [31,35] for a panel of blood chemistry markers, including fasting glucose, haemoglobin, LDL-C, TC, high-density lipoprotein cholesterol, triglycerides, alanine aminotransferase (ALT), aspartate aminotransferase (AST), hepatitis B surface antigen (HBsAg), and hepatitis C virus (HCV) antibody. Those who tested positive for HBsAg were referred to as subjects with hepatitis B virus (HBV) infection, and those who tested positive for HCV antibody were defined as having HCV infection.
Covariates were selected a priori based on biological plausibility and established causal frameworks for lipid-related mortality. To ensure methodological robustness and comparability, the selection and categorisation of these variables encompassing sociodemographic factors, lifestyle habits, and baseline clinical markers strictly adhered to previous studies conducted within the MJ Cohort [31,32]. We categorised age (i.e. 20–39, 40–64, and ≥65 years), systolic blood pressure (i.e.<120, 120–139, and ≥140 mm Hg), and fasting glucose (i.e. <110, 110–125, and ≥126 mg/dL) into three groups each. We divided body mass index (BMI) into four groups (i.e. <18.5, 18.5–24.9, 25–29.9, and ≥30 kg/m2). We classified smoking as nonsmoker, current-smoker, or ex-smoker, defining smokers as those who self-reported that they had smoked ≥100 cigarettes during their lifetime. We calculated smoking pack-years as frequency (times/week) × cigarette count/d × smoking last year. We classified alcohol consumption as non-drinker, occasional drinker, or regular drinker, defining regular alcohol drinkers as those who had ≥2 drinks at one time or ≥3 times a week, and occasional drinkers as those who had fewer drinks than regular drinkers. We calculated alcohol consumption cup-year as frequency (times/week) × cup count/d × drinking last year. We calculated leisure time physical activity volume using the product of intensity and duration, classifying it as inactive, low, and fully active. We defined participants who self-reported a diagnosis with common chronic diseases such as CVD, diabetes, liver cirrhosis, and kidney disease or who were currently taking relevant medication as having the corresponding disease.
Primary and secondary outcomes
To reduce outcome misclassification, the vital status of each participant from January 1996 onwards was ascertained via deterministic linkage to the Taiwan Cause of Death Registry, a validated tracking system with high coverage. The top five ranked causes of death, including cancer, CVDs, diabetes, liver cirrhosis, and kidney diseases, were identified based on the codes of the International Classification of Diseases, 9th Revision (ICD-9), and 10th Revision Clinical Modification (ICD-10-CM). The primary outcome was all-cause mortality (ICD-9: 001–999; ICD-10: A00–Y98). The secondary outcomes were cause-specific mortality categories derived from the same registry using ICD-9 and ICD-10 codes, including cancer mortality (all cancers, liver cancer, and non-liver cancer), non-cancer mortality, and the top-ranked causes of death in this cohort (i.e. CVD and its subtypes, diabetes, liver cirrhosis, and kidney diseases). The ICD codes used were: all cancer (ICD-9: 140–239; ICD-10: C00–D48); liver cancer (ICD-9: 155; ICD-10: C22); non-liver cancer (ICD-9: 140–239, except 155; ICD-10: C00–D48, except C22); non-cancer mortality (ICD-9: codes excluding 140–239; ICD-10: codes excluding C00–D48); CVD (ICD-9: 390–459; ICD-10: I00–I99); coronary heart disease (CHD) (ICD-9: 410–414; ICD-10: I20–I25); ischaemic stroke (ICD-9: 434 and 436; ICD-10: I63–I64); haemorrhagic stroke (ICD-9: 430–431; ICD-10: I60–I61); diabetes (ICD-9: 249–250; ICD-10: E08–E13); liver cirrhosis (ICD-9: 571; ICD-10: K74); and kidney diseases (ICD-9: 588–599; ICD-10: N00–N39). Deaths were classified as non-cancer-related if the underlying cause of death was not cancer-related.
Statistical analysis
We defined very low cholesterol as LDL-C<70 mg/dL or TC<130 mg/dL, low cholesterol as LDL-C<100 mg/dL or TC<160 mg/dL, and high cholesterol as LDL-C≥180 mg/dL or TC≥240 mg/dL.
We used Cox proportional hazards models to assess the association of categorised LDL-C and TC levels and all-cause and cause-specific mortality. We evaluated the proportional hazards assumption using both formal proportionality testing and visual inspection of the Kaplan-Meier survival curves. While formal testing is inherently hypersensitive to negligible deviations due to the massive sample size, visual inspection confirmed that the Kaplan-Meier survival curves across cholesterol strata remained proportional and non-intersecting.
We adjusted the models for age group, sex, marital status category, occupation category, educational attainment category, fruit consumption category, hepatitis status (binary), BMI category, systolic blood pressure category, fasting glucose level (categorical), smoking pack-year (continuous), alcohol cup-year (continuous), physical activity category, and cancer history (binary). We estimated HRs and corresponding 95% confidence intervals (CIs). Findings regarding cause-specific mortality, as well as subgroup and sensitivity analyses, should be considered secondary and exploratory. For these endpoints, we emphasised the magnitude and precision of effect sizes rather than relying exclusively on statistical significance. Missing covariate data were handled consistently using a complete-case analysis. Because HR is a non-collapsible measure, differences between unadjusted and adjusted estimates may reflect both confounding control and the estimator’s mathematical non-collapsibility.
To examine the continuous dose-response association and identify the mortality risk nadir, we applied restricted cubic splines with four knots. For categorical analyses, we utilised established clinical thresholds rather than arbitrary quantiles. This approach facilitates clinical interpretability and maintains methodological consistency with prior observational studies [31].
We performed a series of pre-specified sensitivity analyses to verify the robustness of our primary findings and systematically address potential reverse causation, measurement bias, and residual confounding. We excluded participants who died within the first five years of follow-up to mitigate reverse causation driven by undiagnosed fatal diseases that may simultaneously reduce cholesterol levels and increase mortality risk. We also excluded those with hepatitis B or C virus infection, since chronic HBV/HCV infection directly impairs hepatic function, thus leading to reduced circulating cholesterol levels and those who had a history of cancer, CVD, diabetes, liver cirrhosis, or kidney disease at enrolment to minimise confounding from baseline health status and systemic inflammation. We reassessed the association between low cholesterol and mortality using lipid measurements from the second follow-up visit to assess the stability of exposure measurement and mitigate regression dilution bias. We additionally adjusted for baseline liver enzymes to account for residual confounding related to hepatic function. We excluded underweight participants (BMI<18.5 kg/m2) or anaemic at baseline because they usually indicate malnutrition, chronic consumptive diseases or underlying severe systemic conditions. We restricted the analysis exclusively to participants recruited in the earliest recruitment period (the ‘pre-statin era’) to reduce confounding by indication from pharmacologically lowered cholesterol. We also applied the Fine-Gray subdistribution hazard model to assess the impacts of competing risks of cancer mortality, and conducted analyses using multiple imputations via fully conditional specifications with predictive mean matching (mean = 5) to address potential bias arising from missing data.
We further conducted stratified analyses by demographic, behavioural, and medical characteristics. We calculated life expectancy using Chiang’s life table method [36]. To assess the robustness of our findings against potential unmeasured confounding, we calculated the e-value, which provides a measure of the minimum strength of association that an unmeasured confounder would need to have with both the exposure and the outcome to fully explain away the observed association. We calculated the e-value based on the observed HR for the association between low cholesterol levels and mortality, using the formula provided by VanderWeele and Ding [37].
We used SAS, version 9.4 (SAS Institute Inc., Cary, North Carolina, USA) and R, version 4.3.2 (R Core Team, Vienna, Austria) for all analyses, and a two-sided P-value of <0.05 was considered statistically significant.
RESULTS
We included a total of 374 354 participants, with a median follow-up duration of 10.0 years. The proportion of participants with low cholesterol levels was 29.3% for low LDL-C (<100 mg/dL) and 17.5% for low TC (<160 mg/dL). Participants with low LDL-C tended to be female, younger (20–39 years), underweight (<18.5 kg/m2), less likely to smoke or drink, were inactive or not very active for exercise, and had no anaemia, whereas those with high cholesterol were more likely to have higher systolic blood pressure, higher fasting glucose levels, and had no history of HBV and HCV infection (Table 1). The levels of BMI, LDL-C, TC, AST, and ALT were generally comparable between the included analytical cohort and the 127 969 individuals excluded due to missing covariates (Table S1 in the Online Supplementary Document).
Table 1. Distribution of characteristics (in percentage) by LDL-C and TC groups
BMI – body mass index, HBV – hepatitis B virus, HCV – hepatitis C virus, LDL-C – low-density lipoprotein cholesterol, SBP – systolic blood pressure, TC – total cholesterol
*Anaemia is defined as haemoglobin level of <13 g/dL for men and <12 g/dL for women.
†Non-missing count for LDL-C or TC.
Associations with all-cause mortality
A U-shaped association was found between cholesterol levels and all-cause mortality (Figure 1, Panel A, Table 2; Figure S1, Table S2 in the Online Supplementary Document). Continuous modelling via restricted cubic splines confirmed the U-shaped association between cholesterol levels and all-cause mortality, independent of predefined categories (Figure S2 in the Online Supplementary Document). The mortality risk nadir was observed at approximately 120 mg/dL for LDL-C and 200 mg/dL for TC.
Figure 1. LDL-C levels and hazard ratios for mortality. Panel A. All-cause mortality. Panel B. Cancer. Panel C. Coronary heart disease. Panel D. Haemorrhagic stroke. Panel E. Liver cirrhosis. Adjusted for age groups, sex, marital status category, occupation category, educational attainment, fruit consumption, hepatitis status, body mass index, systolic blood pressure, fasting glucose level, smoking pack-year, alcohol cup-year, physical activity, and cancer history; reference group was LDL-C = 110–129 mg/dL. LDL-C – low-density lipoprotein cholesterol.
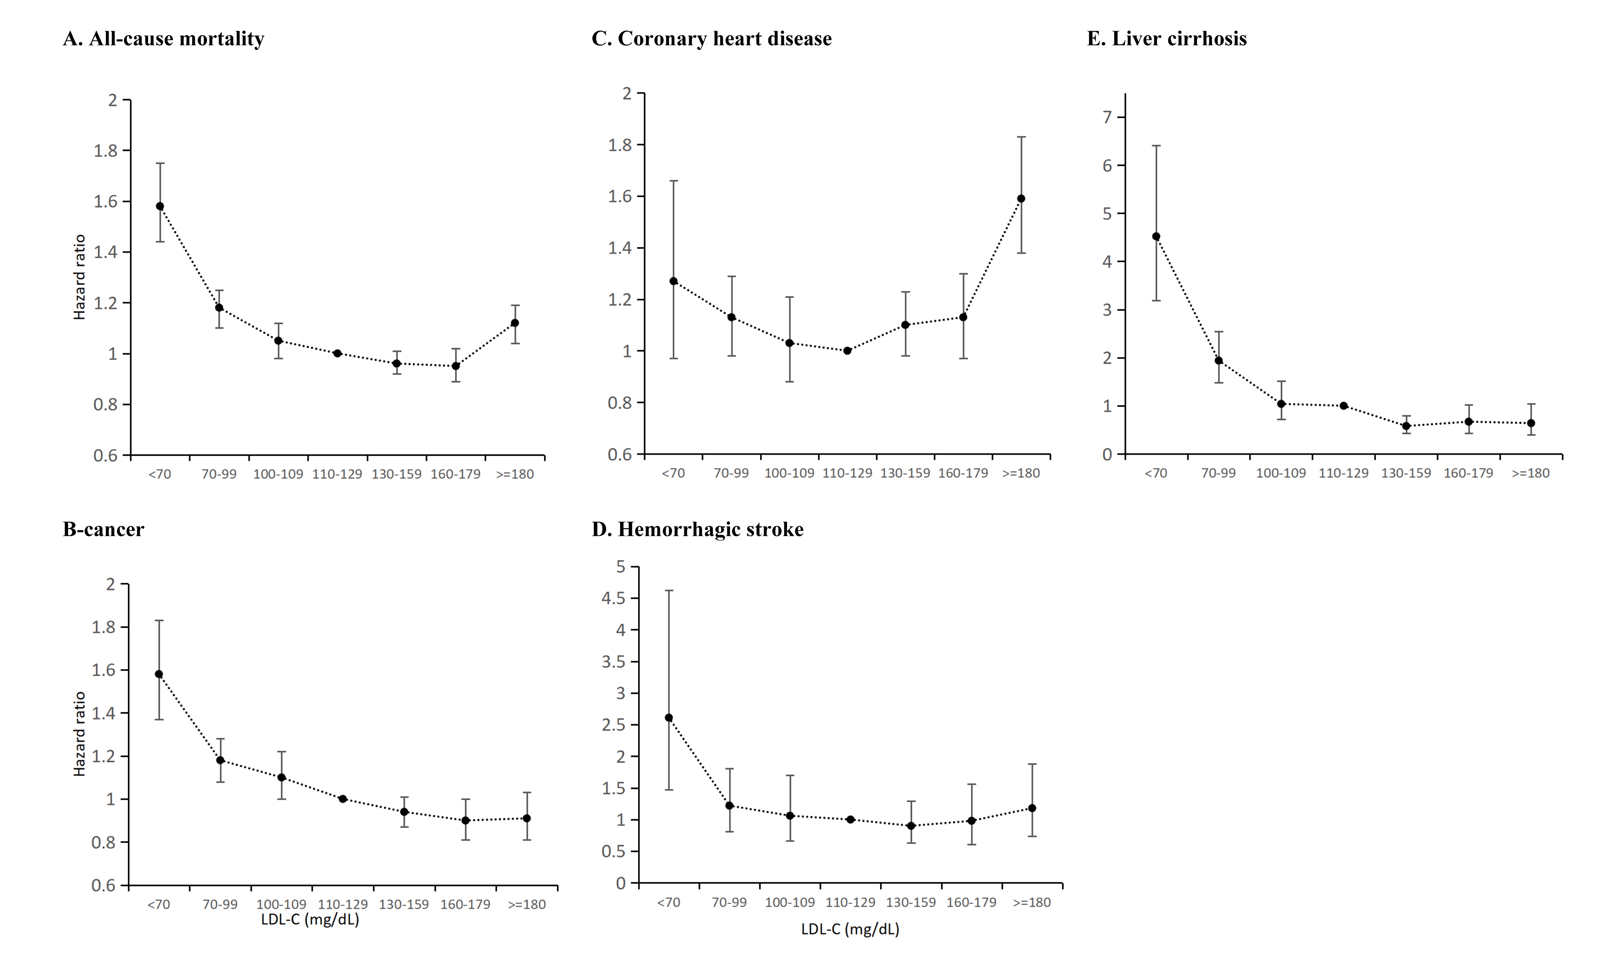
Table 2. Multivariable aHRs for all-cause and cause-specific mortality by LDL-C levels*
CHD – coronary heart disease, CI – confidence interval, CVD – cardiovascular disease, HR – hazard ratio, LDL-C – low-density lipoprotein cholesterol, ref – reference
*Adjusted for age groups, sex, marital status category, occupation category, educational attainment category, fruit consumption category, hepatitis status, body mass index category, systolic blood pressure category, fasting glucose level, smoking pack-year, alcohol cup-year, physical activity category, and cancer history.
Compared to the reference group (110–129 mg/dL), participants with low LDL-C (<100 mg/dL) exhibited a 24% increased hazard of all-cause mortality (HR = 1.24; 95% CI = 1.17–1.30). Similarly, participants with low TC (<160 mg/dL) exhibited a 38% increased hazard of all-cause mortality (HR = 1.38; 95% CI = 1.30–1.47) compared to the TC reference group (180–199 mg/dL). Furthermore, the magnitude of the increase in mortality risk for high cholesterol was smaller than that for low cholesterol. There was a 12% higher all-cause mortality risk for high LDL-C (≥180 mg/dL) group (HR = 1.12; 95% CI = 1.04–1.19) and an 8% higher risk for high TC (≥240 mg/dL) group (HR = 1.08; 95% CI = 1.02–1.14) (Table 2; Table S2 in the Online Supplementary Document).
The joint crosstab associations of LDL-C and TC with all-cause mortality showed that individuals with concurrently low or very low LDL-C and TC levels had the highest risk compared with those with either one alone (Table 3). Specifically, when both cholesterol levels were at very low levels, the mortality risk was more than doubled (HR = 2.31; 95% CI = 1.99–2.68). While the precision of the estimates varied across specific cells, the direction of the effect sizes consistently indicated an increased mortality hazard for lower levels of both lipid measures.
Table 3. Cross-tabulation and joint effects of LDL-C and TC levels*
CI – confidence interval, HR – hazard ratio, LDL-C – low-density lipoprotein cholesterol, TC – total cholesterol
*Adjusted for age groups, sex, marital status category, occupation category, educational attainment category, fruit consumption category, hepatitis status, body mass index (BMI) category, systolic blood pressure (SBP) category, fasting glucose level, smoking pack-year, alcohol cup-year, physical activity category, and cancer history.
†Percentage of participants is <0.01%, or there were no participants at all in these categories.
Associations with cause-specific mortality
High TC level (≥240 mg/dL) was associated with a 11% reduction in all-cancer mortality (HR = 0.89; 95% CI = 0.81–0.97), relative to the reference group (Figure 1, Panel B). Furthermore, accounting for competing risks using the Fine-Gray model yielded findings consistent with our primary cause-specific mortality analyses, including the inverse association between high cholesterol and cancer mortality (Table S3 in the Online Supplementary Document). Approximately one-third of cancer deaths among individuals with low cholesterol levels were due to liver cancer, with comparable results for LDL-C (HR = 1.90; 95% CI = 1.61–2.25) and TC (HR = 2.59; 95% CI = 2.16–3.12) (Table 2; Table S2 in the Online Supplementary Document). Similar patterns were found for liver cirrhosis as well (Figure 1, Panel E), implying that excesses in liver diseases may be responsible for a significant portion of excess deaths among low-cholesterol participants. After excluding liver cancer-related deaths from all-cancer deaths, the non-liver cancer still showed an excess risk of 8% in LDL-C (HR = 1.08; 95% CI = 0.98–1.19) and 16% in TC (HR = 1.16; 95% CI = 1.04–1.30).
For cause-specific mortality, low LDL-C was found to be associated with a 41% increase for haemorrhagic stroke mortality (HR = 1.41; 95% CI = 0.98–2.04). With a J-shaped association, CHD-related mortality was not higher at low cholesterol levels but was higher among those with high LDL-C (≥180 mg/dL) (HR = 2.24; 95% CI = 1.73–2.91) (Figure 1, Panels C and D). Similar association patterns were observed among other causes of death as well.
Life expectancy
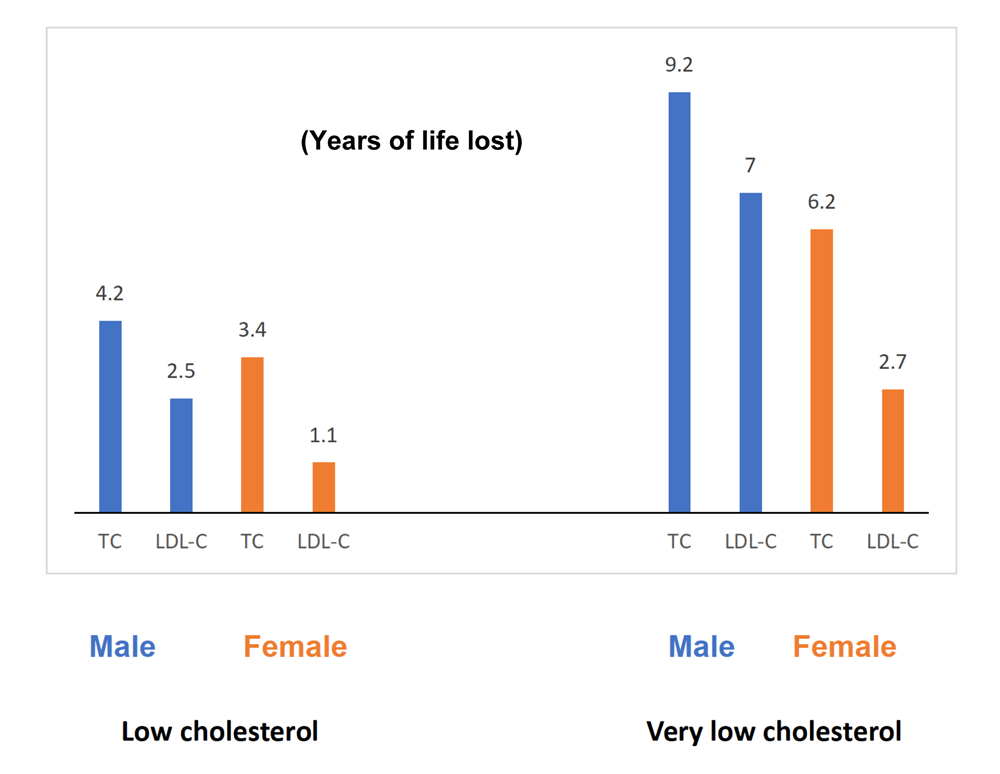
Based on Chiang’s life table method, individuals with low cholesterol levels exhibited an unadjusted 1.1–4.2 years of life lost, and those with very low cholesterol levels exhibited an unadjusted difference in observed survival of 2.7–9.2 fewer years, for both men and women (Figure 2). These metrics are descriptive projections illustrating the aggregate mortality burden of these subgroups, not adjusted causal estimates. In contrast, for this cohort, high cholesterol was associated with shorter life by 1.5–2.9 years (Figure S3 in the Online Supplementary Document).
Figure 2. The life-shortening effect of low cholesterol and very low cholesterol by sex. Low cholesterol was defined as TC<160 mg/dL and LDL-C<100 mg/dL; very low cholesterol was defined as TC<130 mg/dL and LDL-C<70 mg/dL; reference groups were TC = 180–199 mg/dL and LDL-C = 110–129 mg/dL. LDL-C – low-density lipoprotein cholesterol, TC – total cholesterol.
Secondary and sensitivity analyses
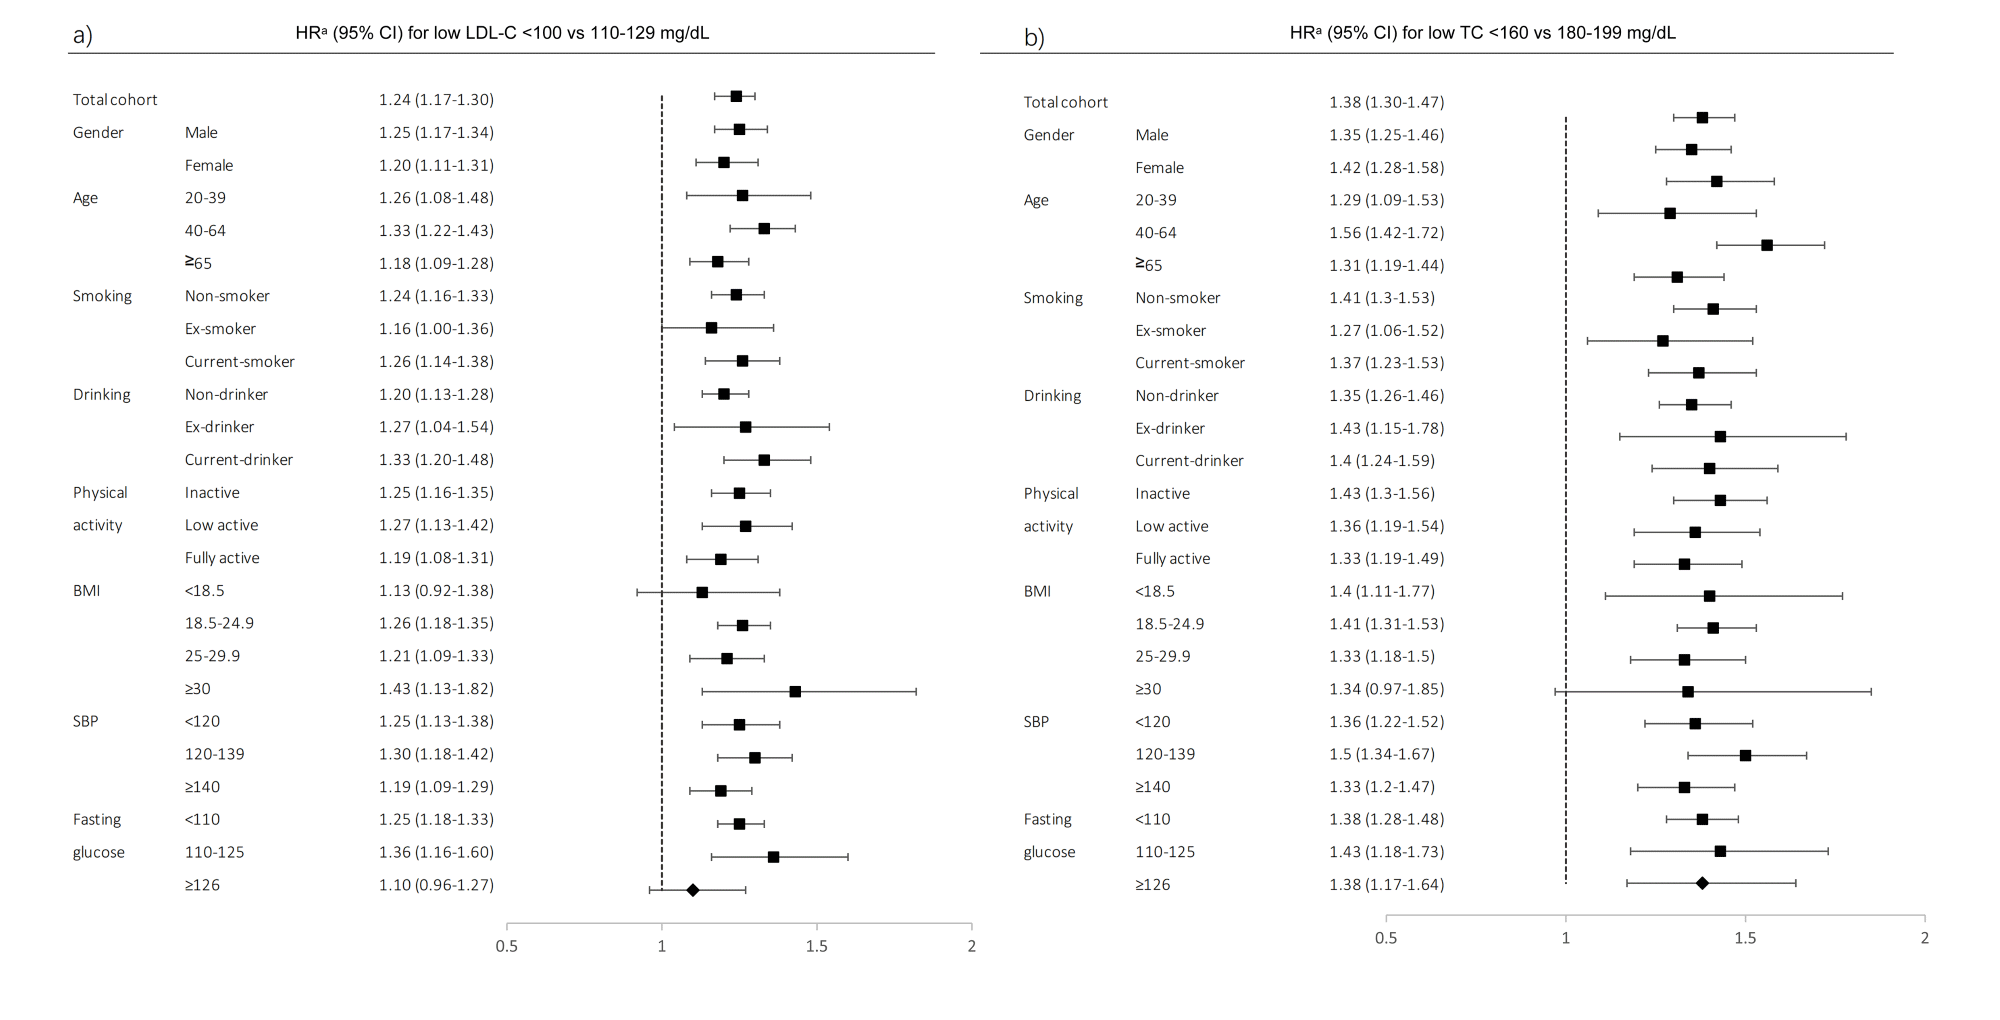
The associations of low LDL-C and low TC levels with all-cause mortality were evaluated according to groups of each covariate (Figure 3, Panels A and B; Tables S4 and S5 in the Online Supplementary Document). The inverse associations between LDL-C and TC with mortality were consistently found, regardless of sex, age, smoking status, drinking status, physical activity, BMI, hypertension, and diabetes.
Figure 3. Forest plots of HRs for individuals with low LDL-C and low TC levels by participant characteristics. Panel A. Low LDL-C. Panel B. Low TC. Adjusted for age groups, sex, marital status, occupation, educational attainment, fruit consumption, hepatitis status, body mass index, systolic blood pressure, fasting glucose level, smoking pack-year, alcohol cup-year, physical activity, and cancer history. BMI – body mass index, CI – confidence interval, HR – hazard ratio, LDL-C – low-density lipoprotein cholesterol, SBP – systolic blood pressure, TC – total cholesterol.
When we excluded participants who died within the first five years or had HBV or HCV infections, the increased risk for low LDL-C and low TC levels remained for all-cause, all-cancer, and non-cancer mortality. We further excluded those with a history of cancer, CVD, diabetes, liver cirrhosis, or kidney disease, and the observed higher mortality risk among low cholesterol levels remained (Figures S4–6 in the Online Supplementary Document). The inverse association between low cholesterol and mortality remained robust after additional adjustment for ALT and AST, as well as in restricted cohorts excluding individuals who were underweight or anaemic. To exclude potential confounding by indication, we evaluated the annual prevalence of lipid-lowering medication use across the recruitment period (1996–2010), which remained consistently low, ranging from 0.78% to 1.34% (Table S6–8 in the Online Supplementary Document). Furthermore, restricting the analysis exclusively to the earliest recruitment period (the ‘pre-statin era’) yielded consistently elevated mortality risks, confirming that the associations were not confounded by modern lipid-lowering therapies. For the highest observed HR of 1.58 in LDL-C and mortality analysis, the e-value was 2.54, indicating that an unmeasured confounder would need to be associated with both exposure and outcome by a risk ratio of 2.54-fold, beyond the measured confounders, to fully explain the observed association (Tables S9–11 in the Online Supplementary Document). The association between lower cholesterol and all-cause mortality deriving from the second visit remained. The pooled estimates from the imputed data sets yielded results consistent with the primary findings, confirming the robustness of the epidemiological associations (Figure S7 and Table S12 in the Online Supplementary Document).
DISCUSSION
Our results showed that naturally occurring low cholesterol, a common but under-recognised trait among East Asians, is associated with elevated risks of all-cause mortality and cause-specific mortality and with significant reductions in life expectancy by 1.1–4.2 years for low cholesterol and 2.7–9.2 years for very low cholesterol.
We provide important implications for public health education and population-level health policy. Given the observational design of our cohort study, these results should not be used to inform direct clinical decisions or modify existing lipid-lowering treatments for high-risk patients. Instead, from a population health perspective, naturally low cholesterol levels among asymptomatic members of the general population ought to be regarded as an epidemiological marker of underlying health vulnerability, rather than an absolute measure of optimal health. At the policy level, this indicates that the universal ‘lower is better’ paradigm requires greater nuance and should not be broadly applied to the general public without accounting for individuals’ baseline health status. While statin trials demonstrate proportional cardiovascular benefits with LDL-C lowering (26% risk reduction per 38.7 mg/dL decrease) [38], these findings primarily derive from Western cohorts or trials with shorter follow-up periods, often excluding underweight individuals or those with chronic, non-pharmacologically mediated hypocholesterolaemia [6], and pre-existing cardiovascular risk, conditions significantly differing from the general population cohort. Furthermore, clinical trials are usually performed among individuals at high risk of atherosclerotic CVD with limited sample sizes, wider fluctuations in cholesterol levels, and the tendency to resume higher levels when statins are discontinued. In addition, in clinical trials, cholesterol levels may not become extremely low or extremely high, limiting the ability to observe risks associated with certain cholesterol levels. In contrast, our cohort reflects a general East Asian population, where low cholesterol levels may frequently arise from dietary patterns or low BMI. The aetiological factor of low levels of cholesterol may be the key to explain the differences between previous clinical trials and our study. Since we enrolled a general population, low cholesterol levels came mainly from naturally occurring causes and may have existed for a long time. This divergence underscores the critical importance of population context in interpreting cholesterol’s health implications.
Whether the relationship between low cholesterol and mortality could be East Asian-specific is an important question [39]. Reports on higher risks in the general population among non-Asians were frequently encountered, although they were less pervasive than among Asians. For example, increased all-cause mortality was found in other Asian countries, such as Korea [18,23,27], Japan [17,20,26], and China [21,22,30], and in non-Asian countries such as Italy [19], Denmark [24], and the USA [25,28,29]. East Asians had lower CHD mortality and higher prevalence of low cholesterol than non-Asians [40,41]. In contrast to CHD being the leading cause of death in Western populations, East Asians were different, with cancer deaths occurring 2.5 times more than CHD deaths, making cancer the top cause of death for nearly four decades in Taiwan. Crucially, these implications highlight profound cross-cultural variations. Because East Asians naturally exhibit lower baseline cholesterol levels and a mortality profile that was dominated by cancer and haemorrhagic stroke rather than CHD, global public health strategies and risk-stratification models derived primarily from Western cohorts require careful contextual recalibration.
We found a strengthened association between low cholesterol and cancer mortality. Although the inverse association between high cholesterol levels and cancer mortality persisted in our competing risk analysis, this finding may also reflect residual confounding or unmeasured baseline characteristics rather than a true protective biological effect. A central concern in observational studies is reverse causality, whether low cholesterol reflects preexisting disease rather than contributing to mortality [9,42,43]. Another not-well-known fact is that low cholesterol is closely related to the presence of HCV [24]. Regression to the mean and temporal fluctuations in cholesterol levels may further dilute observed associations. However, we robustly countered these hypotheses through our sensitivity analyses. Notably, mortality risks persisted after excluding individuals who died within five years of baseline survey, individuals with liver-related deaths, or individuals with HBV/HCV infections, suggesting that low cholesterol’s harms extend beyond hepatic pathophysiology. Repeated cholesterol measurements in subsequent visits solidified the relationship between persistently low levels and mortality. Among participants who returned for a second examination (44%; average interval of two years), those with confirmed low cholesterol at follow-up maintained elevated mortality, comparable to the HRs observed at baseline. This temporal consistency suggested that regression to the mean does not fully account for the association, though the slight attenuation in HRs aligns with known intraindividual cholesterol variability, strengthening the argument for causality rather than transient measurement artefacts. Furthermore, the consistency of findings across subgroups reinforced the role of low cholesterol as an independent risk factor. Clinical studies have linked heightened diabetes and haemorrhagic stroke to individuals with low cholesterol [45,46]. While our sensitivity analyses excluding underweight and anaemic participants, along with adjustments for liver enzymes, confirmed the robustness of our findings, we acknowledge that residual confounding from unmeasured markers of frailty or chronic inflammation cannot be eliminated.
Our findings of a U-shaped association between LDL-C and all-cause mortality are consistent with global evidence, reporting inverse LDL-C-mortality associations, particularly in elderly and non-Western cohorts [18,25,28]. While a systematic review of elderly cohorts suggested that high LDL-C is often inversely associated with mortality in those aged >60 years [47], our study extends this observation to a much broader age spectrum. Unlike the Korean nationwide studies that focused specifically on older adults and senior cohorts [48,49], our analysis of the MJ Cohort included >370 000 individuals aged >20 years. This allowed us to identify that the mortality risk associated with low LDL-C is not only present in the elderly but is even more pronounced in younger adults (20–39 years). This suggests that the ‘cholesterol paradox’ observed in earlier meta-analyses may be a pervasive biological phenomenon rather than one limited to geriatric populations. Analyses of young Korean adults and the Danish general population, groups unexposed to lipid-lowering therapies, were consistent with our findings [25,28], suggesting that low cholesterol’s risks may transcend geographic boundaries. Nevertheless, East Asia’s unique epidemiological profile (e.g. high cancer prevalence and low baseline CHD mortality) amplifies the population-level significance of these associations.
Our decision to analyse both LDL-C and TC was rooted in their distinct yet interconnected roles in evaluating lipid profiles and cardiovascular risk. Recognised for its specificity in predicting atherosclerotic pathology, LDL-C directly reflects atherogenic particle burden. Conversely, TC represents a composite measure that offers a holistic view of systemic cholesterol homeostasis. Investigating both metrics allowed us to explore whether mortality associations stemmed predominantly from atherogenic mechanisms or the aggregate influence of all cholesterol subfractions. Importantly, while current clinical guidelines emphasise LDL-C as a primary target for therapeutic strategies, TC continues to serve as a practical metric in widely adopted risk assessment frameworks and in settings with limited access to advanced lipid profiling. By integrating both measures, our findings bridge guideline-driven priorities with the pragmatic realities of healthcare practice, ensuring relevance across diverse clinical environments.
Consistent with the inherent characteristics of observational research, this study has several limitations, all of which we comprehensively assessed to ensure the reliability of our core conclusions. To mitigate potential reverse causation driven by undiagnosed comorbidities accompanying low cholesterol levels that may contribute to mortality, we conducted sensitivity analyses excluding all deaths occurring within the first five years of follow-up, which effectively minimised this bias. While the theoretical possibility that baseline cholesterol levels were affected by lipid-lowering treatment cannot be fully eliminated, we initiated our study in 1994, when statin use was extremely rare in Taiwan, rendering this factor’s impact on our results negligible. As with all observational studies, residual confounding, outcome misclassification, or non-differential measurement error cannot be completely ruled out. However, we adjusted for a comprehensive set of key covariates. E-value analyses confirmed that unmeasured confounding is highly unlikely to substantially alter our main findings, and non-differential error would only bias effect estimates toward the null without overestimating the observed associations. We further verified the robustness of our complete-case analysis through multiple imputation. Finally, our findings were derived from a Taiwanese population and thus should be extrapolated to populations of other ethnicities or socioeconomic statuses with appropriate caution.
CONCLUSIONS
This large prospective cohort of East Asian adults showed a robust U-shaped association between cholesterol levels and mortality. Notably, naturally occurring low LDL-C and TC were associated with 24% and 38% higher hazards of all-cause mortality, respectively, corresponding to a 1–4-year shorter life expectancy. Rather than challenging established lipid-lowering guidelines for cardiovascular risk reduction, these observational findings suggested that unexpectedly low cholesterol in the general, untreated population may serve as a critical biomarker of underlying physiological vulnerability. Encountering non-pharmacological hypocholesterolaemia should therefore prompt heightened clinical vigilance for occult disease, malnutrition, or frailty.