

The global prevalence of childhood obesity tripled between 1975 and 2016, making it a pressing public health crisis with far-reaching health, social, and economic implications [1]. By 2025, the global obesity prevalence among 5–19-year-olds reached 9.4% (188 million), surpassing the proportion of underweight children in this group (9.2%) [2]. In 2020, the prevalence of obesity in China was reported to be 3.6% among children <6 years and 7.9% among those aged 6–17 years [3]. This condition – with an aetiology involving interactions between heritable predisposition and modifiable environmental factors (e.g. excess gestational weight gain, parental obesity, and obesogenic lifestyle habits) – imposes a significant morbidity burden [4–6]. Frequently persisting into adulthood, childhood obesity leads to metabolic, cardiovascular, and psychosocial sequelae, ultimately resulting in a reduced life span of affected individuals [7–12].
Traditional analytical approaches, such as logistic regression, have been widely used to identify risk factors across a broad range of clinical endpoints, yet often fail to capture complex, nonlinear, or multifactor relationships, thereby constraining their predictive accuracy and clinical application [13,14]. More flexible extensions of traditional methods, such as generalised additive models that address single-dimensional nonlinear relationships, prove computationally cumbersome and difficult to interpret with high-dimensional datasets, especially when accounting for multi-factor interactions. By contrast, machine learning (ML) models have shown promise for enhancing disease prediction performance in handling these complex interactions. However, many existing studies lack external validation or clinical interpretability (the black box problem) and remain untranslated into actionable tools for frontline healthcare use [15–17].
To address these limitations, we developed and externally validated three widely applied ML models alongside logistic regression using a large-scale cohort and multidimensional predictors. Then, we employed SHapley Additive exPlanations (SHAP) to enhance model interpretability, identifying a minimal set of core predictors that retain high predictive efficacy. Lastly, we deployed a clinically actionable web-based tool that delivers individualised childhood obesity risk probabilities, while offering SHAP-derived explanations to inform clinical decision-making.
METHODS
Study design and participants
We conducted four cross-sectional surveys in 2019, 2020, 2022, and 2024 using stratified cluster sampling, targeting children and adolescents aged 2–18 years from Beijing and Tangshan, China. In the first survey (September to November 2019), we recruited 3–6-year-old children in Beijing by randomly selecting four (two urban, two suburban) out of 16 districts, with five kindergartens sampled per district. In the second survey (September to December 2020), we focused on preschool-aged children in Tangshan, with two of seven districts sampled and five kindergartens selected per district. The third survey (January 2022) was conducted in Pinggu district, Beijing, within eight primary and eighteen junior high schools. In the fourth survey (April to May 2024), again in Pinggu district, we enrolled children and adolescents aged 2–18 years from seven kindergartens, seven primary schools, and three junior high schools.
For analysis, we combined data from the 2019, 2022, and 2024 Beijing surveys to form the model development dataset (training/testing), while the 2020 Tangshan survey data served as an independent external validation set. Beijing and Tangshan differ in many aspects. For example, according to the 2022 census data, there are approximately 21.8 million people in Beijing and 7.7 million in Tangshan. There are 16 districts in Beijing and 7 in Tangshan, covering an area of 16 410 km2 and 13 472 km2, respectively. Per capita disposable income was RMB 77 400 in Beijing and RMB 39 600 in Tangshan.
We report our findings per the STROBE statement checklist (Table S1 in the Online Supplementary Document). The ethics committees of China-Japan Friendship Hospital (2018-93-K67, 2024-KY-084) and Beijing University of Chinese Medicine (2022BZYLL0906) provided ethical approval for this study. Written informed consent was obtained from the parents or guardians of study participants and the children and adolescents over the age of eight years.
Data collection and variable definition
Trained health practitioners performed standardised anthropometric measurements (height in cm and weight in kg, both recorded to one decimal place) at baseline in participating kindergartens or schools. Weight and height were measured using a calibrated mechanical scale (Model RGZ-120; verification division e = 500g, Changzhou, China) and a calibrated SECA-213 stadiometer (SECA GMBH & Co. KG, Hamburg, Germany), respectively, across study sites. All practitioners and supervising teachers received standardised training to ensure consistency in procedures, measurement procedures, and methodological uniformity, and to minimise bias.
Besides body height and weight, additional data were collected using structured questionnaires covering five domains: demographics (age, sex, and date of birth); perinatal characteristics (gestational age, delivery mode, birth length, birth weight, infant feeding method, breastfeeding duration, and time to solid food addition); lifestyle factors (sleep duration, sedentary behavior, physical activity, consumption of sweet or fried foods, and midnight snack eating); allergy history (asthma, eczema, food/drug allergy); family background (household income, parental anthropometric measurements, parental education attainment, and parental reproductive age). We selected these factors based on existing literature and expert consensus to capture both known and potential determinants of childhood overweight or obesity [18–24].
To ensure the reliability and validity of our survey questionnaires, we ran a pilot test with 200 randomly selected participants before formal distribution, where the Cronbach’s alpha reliability coefficient exceeded 0.85.
Obesity definition
We calculated the body mass index (BMI) as weight (kg) divided by height squared (m2). Weight status was determined using age- and sex-standardised BMI z-scores for children, calculated as the standard deviation (SD) difference between an individual’s BMI and the population mean. Based on World Health Organization (WHO) growth standards (2006 for children aged 0–5 years [25], 2007 reference for children aged 5–19 years [26]), we defined underweight as a BMI z-score < −2 SD, overweight as a BMI z-score > +1 SD, and obesity as a BMI z-score > +2 SD. Here, we excluded underweight and overweight children and adolescents, focusing exclusively on children with obesity or normal weight.
Quality control
After extracting the data from the Wenjuanxing digital platform to which the data were uploaded by parents or legal guardians, we addressed incomplete responses or anomalous entries by prompting designated teachers and school health professionals to contact parents or guardians to either supplement missing information or verify questionable responses.
Statistical analyses
Data processing
We preprocessed the data through seven steps, by: excluding features with >30% missing values; recoding outliers (defined as values beyond Q1 ± 1.5 × interquartile range (IQR), per the Tukey method) as missing values; applying multiple imputation by chained equations to fill missing data; utilising synthetic minority oversampling technique to mitigate class imbalance (~3.6:1 control-to-case ratio); removing multicollinear features (variance inflation factor >10); excluding of one variable from correlated pairs (Spearman’s ρ ≥ 0.9); selecting features related to childhood obesity using three methods (least absolute shrinkage and selection operator (LASSO), Boruta, and recursive feature elimination); random partitioning of the Beijing data set into training (70%) and testing (30%) cohorts.
Model selection
The three feature selection methods rely on different analytical approaches. The LASSO employs L1 regularisation to penalise less relevant features. Boruta uses a permutation-based approach to pinpoint statistically significant features. Recursive feature elimination iteratively removes the least informative features based on model importance scores, effectively reducing dimensionality. To enhance robustness and mitigate biases inherent in any single method, we adopted a consensus-based threshold – retaining only those features identified by at least two of the three methods (Figure S3 in the Online Supplementary Document). In practice, LASSO narrowed the feature set to 16 clinically relevant features, while Boruta and recursive feature elimination each identified all 25 candidate features.
Model evaluation
Besides logistic regression, we implemented three ensemble learning algorithms: light gradient boosting machine, random forest, and eXtreme gradient boosting (XGBoost). We selected these methods for their ability to handle high-dimensional epidemiological data, model complex nonlinear relationships, and feature importance estimation. All models were tuned via grid search with fivefold cross-validation (30 iterations). We assessed performance on the external testing set using the following metrics: accuracy, area under the receiver operating characteristic curve (AUROC), area under the precision-recall curve, Brier score, classification error, F-beta score, Matthews correlation coefficient, negative predictive value, positive predictive value, sensitivity, and specificity. Bootstrapped 1000 resamples were used to derive 95% confidence intervals (CIs) for all metrics. To avoid data leakage, feature selection and hyperparameter tuning (subsample, max depth, etc.) relied solely on training data, with no validation/testing information used.
To quantify the prediction model’s clinical utility, we performed a decision curve analysis that evaluated the model’s net benefit over a continuous range of threshold probabilities (0−100%) for both the testing set and external validation set. Then, we compared the net benefit against two default strategies: intervening in all participants or none. We visualised the relationship between the number of participants predicted to be high-risk and the actual number of observed positive cases across varying risk thresholds using a clinical impact curve.
Validation to improve readability
SHAP values were used to interpret the optimised model. Subgroup analyses were performed across three age groups (<6, 6 − 12, and >12) in years. Population-level feature importance and individualised prediction contributions were visualised using the two plots: waterfall plots decomposing per-feature risk attribution; directional force plots illustrating feature-specific risk modification. A parsimonious feature subset was derived by iteratively evaluating model performance using SHAP-ranked features.
A secure R Shiny-based web tool was developed for clinical deployment. User-input data generate real-time outputs: individualised obesity risk probability and a personalised SHAP waterfall plot visualising predictive contributors.
Continuous features are presented as mean (SD) or median (interquartile range or IQR), and categorical features as frequency (percentage). Between-group comparisons were performed using independent Student’s t tests, Mann-Whitney U tests, χ2 tests or Fisher exact tests, where appropriate. Statistical significance was defined as a two-tailed P < 0.05.
We conducted all analyses in R, version 4.3.3 (R Core Team, Vienna, Austria) via RStudio Desktop, version 2023.12.1, build 402 (Posit, Boston, Massachusetts, USA), and in Stata, version 18 (StataCorp LLC, TX, USA). Specifically, we used the ‘survey’, ‘mice’, ‘car’, ‘ggplot2’, ‘psych’, ‘caret’, ‘corrplot’, ‘DMwR’, ‘glmnet’, ‘Boruta’, ‘ggcor’, ‘mlr3’, ‘dplyr’, ‘precrec’, ‘praznik’, ‘mlr3verse’, ‘mlr3learners’, ‘mlr3extralearners’, ‘mlr3proba’, ‘mlr3tuning’, ‘mlr3filters’, ‘lightgbm’, ‘ranger’, ‘xgboost’, ‘pROC’, ‘kernelshap’, and ‘shapviz’ in R, and the ‘ttest’, ‘ranksum’, and ‘tabulate’ commands in Stata.
RESULTS
The analytical pipeline comprises three core panels: data processing, model selection, and model evaluation and application (Figure S1 in the Online Supplementary Document). We initially enrolled 24 912 children and adolescents aged 2–18 years, including those with normal weight, underweight, overweight, and obesity, of whom 4108 (16.5%) were classified as obese. After excluding underweight and overweight cases (Figure S2 in the Online Supplementary Document), we retained 16 614 participants from the Beijing development cohort and the 2410 from the Tangshan external validation cohort. Compared with children and adolescents with normal weight, those with obesity were, on average, older, had higher birthweight and parental BMI, shorter sleep duration, and less physical activity. A greater proportion of them were born via caesarean section, had mothers with lower educational attainment, and had a higher prevalence of asthma and eczema (Figure 1, Table 1).
Figure 1. Comparison of continuous variables between children and adolescents with normal weight and obesity. BMI – body mass index. *Continuous data are expressed as mean (standard deviation) or median (interquartile range). P-values for the comparison between children and adolescents with normal weight and obesity were calculated by the independent Student’s t-test for normally distributed data and by rank-sum test for skewed data.
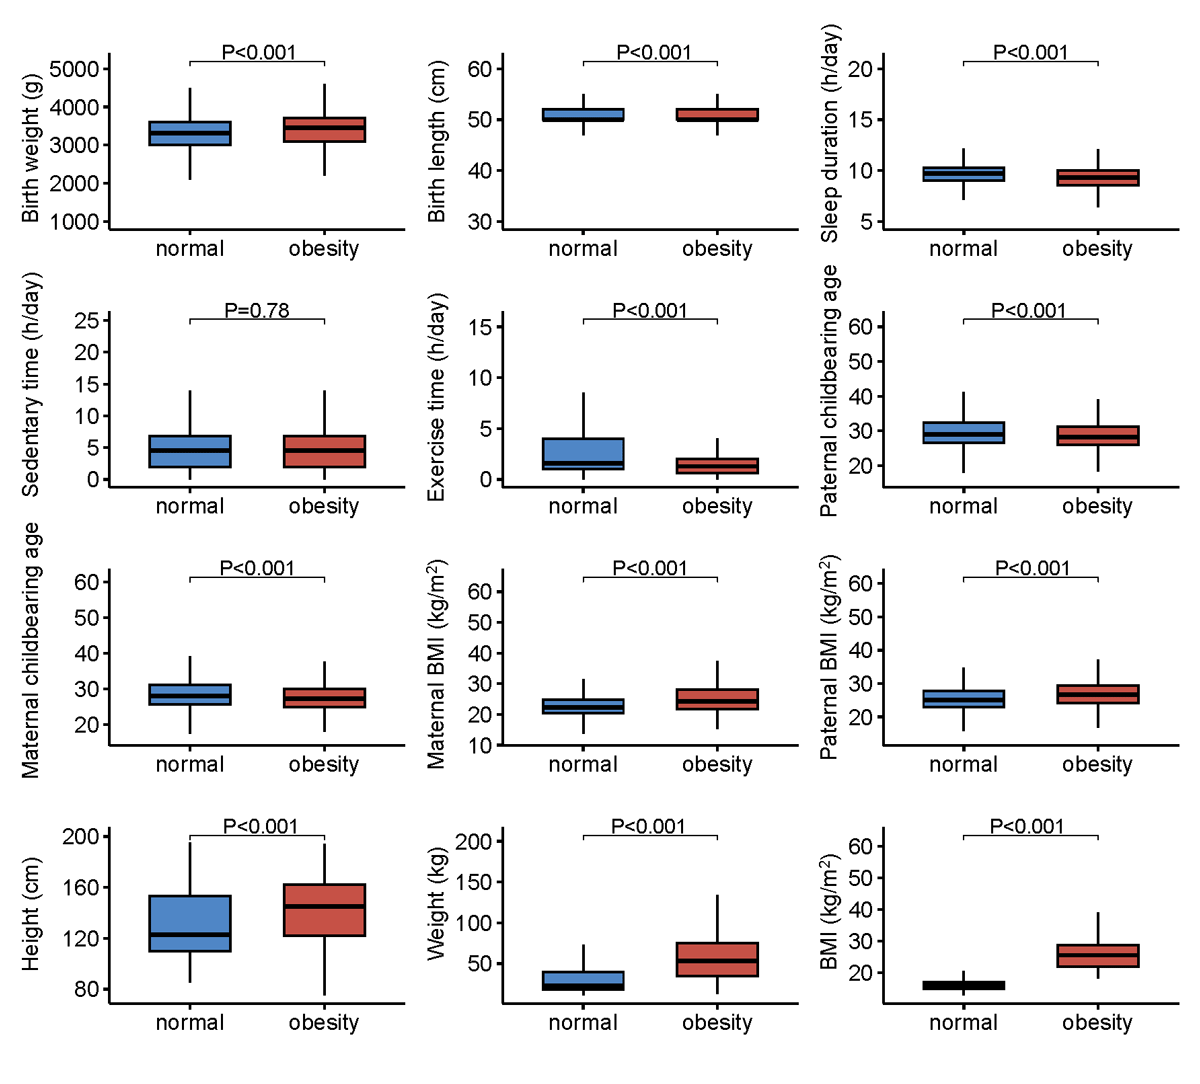
Table 1. Comparison of categorical variables between children and adolescents with normal weight and obesity, n (%)
| Characteristic | Normal weight (n = 14 916) | Obesity (n = 4108) | P-value* |
|---|---|---|---|
| Age in years | <0.001 | ||
| 2–6 | 6795 (45.55) | 1044 (25.41) | |
| 6–12 | 4586 (30.75) | 1876 (45.67) | |
| 12–18 | 3535 (23.70) | 1188 (28.92) | |
| Sex | 0.999 | ||
| Boys | 7356 (49.32) | 2085 (50.75) | |
| Girls | 7560 (50.68) | 2023 (49.25) | |
| Area | <0.001 | ||
| Beijing | 12 836 (86.06) | 3778 (91.97) | |
| Tangshan | 2080 (13.94) | 330 (8.03) | |
| Delivery mode | <0.001 | ||
| Vaginal delivery | 9562 (64.11) | 1996 (48.59) | |
| Cesarean section | 5354 (35.89) | 2112 (51.41) | |
| Gestational age in weeks | 0.003 | ||
| <37 | 1338 (8.97) | 440 (10.71) | |
| 37–42 | 13 138 (88.08) | 3545 (86.30) | |
| ≥42 | 440 (2.95) | 123 (2.99) | |
| Infant feeding method | 0.006 | ||
| Breast feeding | 8819 (59.12) | 2357 (57.38) | |
| Mixed feeding | 4751 (31.85) | 1316 (32.04) | |
| Artificial feeding | 1346 (9.02) | 435 (10.59) | |
| Duration of breastfeeding in months | <0.001 | ||
| <6 | 3743 (25.09) | 1218 (29.65) | |
| 6–24 | 9359 (62.74) | 2426 (59.06) | |
| ≥24 | 1814 (12.16) | 464 (11.30) | |
| Time to add solid food | <0.001 | ||
| <6 months | 2833 (18.99) | 710 (17.28) | |
| 6−9 months | 10 664 (71.49) | 2909 (70.81) | |
| ≥9 months and later | 1419 (9.51) | 489 (11.90) | |
| Maternal education | <0.001 | ||
| High school degree or below | 5406 (36.24) | 1764 (42.94) | |
| Bachelor’s degree | 8279 (55.50) | 2207 (53.72) | |
| Master’s degree or above | 1231 (8.25) | 137 (3.33) | |
| Paternal education | <0.001 | ||
| High school degree or below | 6258 (41.95) | 2051 (49.93) | |
| Bachelor’s degree | 7254 (48.63) | 1904 (46.35) | |
| Master’s degree or above | 1404 (9.41) | 153 (3.72) | |
| Family income (RMB per year) | <0.001 | ||
| <100000 | 5772 (38.70) | 1853 (45.11) | |
| ≥100000 | 9144 (61.30) | 2255 (54.89) | |
| Frequency of eating sweet food | <0.001 | ||
| Daily | 1768 (11.85) | 584 (14.22) | |
| Frequently (≥3 times/week) | 5358 (35.92) | 1706 (41.53) | |
| Occasionally (1–2 times/week) | 5721 (38.35) | 1322 (32.18) | |
| Seldom | 2069 (13.87) | 496 (12.07) | |
| Frequency of eating fried food | <0.001 | ||
| Daily | 2819 (18.90) | 1002 (24.39) | |
| Frequently (≥ 3 times/week) | 3203 (21.47) | 1224 (29.80) | |
| Occasionally (1-2 times/week) | 4550 (30.50) | 986 (24.00) | |
| Seldom | 4344 (29.12) | 896 (21.81) | |
| Eating midnight snacks | <0.001 | ||
| Yes | 8476 (56.82) | 2695 (65.60) | |
| No | 6440 (43.18) | 1413 (34.40) | |
| Asthma | <0.001 | ||
| Yes | 486 (3.26) | 242 (5.89) | |
| No | 14430 (96.74) | 3866 (94.11) | |
| Eczema | 0.620 | ||
| Yes | 3116 (20.89) | 873 (21.25) | |
| No | 11800 (79.11) | 3235 (78.75) | |
| Food/drug allergy | 0.980 | ||
| Yes | 3346 (22.43) | 921 (22.42) | |
| No | 11570 (77.57) | 3187 (77.58) |
*χ2 test or Fisher’s exact test.
Collinearity and correlation assessment
Regarding the correlation and collinearity analyses of continuous features (Figure S3 in the Online Supplementary Document), all variance inflation factor values were <5, indicating no substantial multicollinearity. Pairwise correlations among features were relatively weak (Spearman’s ρ < 0.9), and no features were excluded based on collinearity assessment.
Model selection
We randomly partitioned the Beijing development dataset into training (70%) and testing (30%) subsets, while the Tangshan cohort served as the external validation set. For each ML model, we performed hyperparameter optimisation via grid search using fivefold cross-validation with 30 iterations – a strategy designed to select hyperparameters that balanced model complexity and predictive performance for subsequent validation (Table S2 in the Online Supplementary Document). Following hyperparameter tuning, we trained all ML models and the conventional logistic regression model on the training subset, with subsequent performance evaluated on both the testing and external validation sets.
The XGBoost model exhibited the best discriminative performance on the external validation set (Table 2), achieving the highest discriminative power (AUROC = 0.875), optimal accuracy (0.754), and the lowest Brier score (0.159), as well as a balanced sensitivity (0.645) and specificity (0.861). While the Tangshan cohort exhibited a slightly lower obesity prevalence (13.7%) compared with the Beijing cohort (22.7%), the XGBoost model maintained robust performance on the external validation set. While the sensitivity observed in the Tangshan cohort (0.645) was moderately lower than that in the internal testing set (0.818), the model achieved the highest discriminative ability (AUROC = 0.875) among all tested models.
Table 2. Performance comparison of three machine learning models and conventional logistic regression in predicting obesity on the testing and validation sets in children and adolescents*
| Metric | LightGBM | Logistic regression | Random forest | XGBoost |
|---|---|---|---|---|
| Testing set | ||||
| Accuracy | 0.779 (0.766–0.790) | 0.697 (0.683–0.712) | 0.785 (0.772–0.797) | 0.771 (0.759–0.785) |
| AUROC | 0.855 (0.844–0.866) | 0.760 (0.746–0.774) | 0.868 (0.857–0.878) | 0.849 (0.838–0.861) |
| AUPRC | 0.816 (0.797–0.835) | 0.748 (0.729–0.768) | 0.871 (0.858–0.883) | 0.810 (0.791–0.829) |
| Brier Score | 0.152 (0.146–0.157) | 0.199 (0.194–0.205) | 0.153 (0.148–0.158) | 0.153 (0.147–0.159) |
| Classification Error | 0.221 (0.210–0.234) | 0.303 (0.288–0.317) | 0.215 (0.203–0.228) | 0.229 (0.215–0.241) |
| F-beta | 0.788 (0.774–0.800) | 0.699 (0.683–0.715) | 0.789 (0.776–0.802) | 0.782 (0.768–0.796) |
| MCC | 0.559 (0.534–0.584) | 0.394 (0.365–0.423) | 0.570 (0.544–0.594) | 0.545 (0.520–0.572) |
| NPV | 0.823 (0.808–0.838) | 0.703 (0.683–0.722) | 0.806 (0.789–0.823) | 0.818 (0.802–0.834) |
| PPV | 0.756 (0.739–0.773) | 0.696 (0.677–0.715) | 0.773 (0.756–0.791) | 0.749 (0.732–0.767) |
| Sensitivity | 0.823 (0.808–0.838) | 0.703 (0.683–0.722) | 0.806 (0.789–0.823) | 0.818 (0.802–0.834) |
| Specificity | 0.823 (0.808–0.838) | 0.703 (0.683–0.722) | 0.806 (0.789–0.823) | 0.818 (0.802–0.834) |
| Validation set | ||||
| Accuracy | 0.738 (0.720–0.755) | 0.650 (0.631–0.670) | 0.668 (0.649–0.686) | 0.754 (0.737–0.771) |
| AUROC | 0.863 (0.847–0.877) | 0.718 (0.696–0.739) | 0.786 (0.767–0.804) | 0.875 (0.860–0.889) |
| AUPRC | 0.818 (0.792–0.843) | 0.697 (0.666–0.727) | 0.752 (0.722–0.782) | 0.826 (0.799–0.852) |
| Brier Score | 0.168 (0.160–0.177) | 0.218 (0.211–0.225) | 0.201 (0.194–0.208) | 0.159 (0.151–0.167) |
| Classification Error | 0.262 (0.245–0.280) | 0.350 (0.330–0.369) | 0.332 (0.314–0.351) | 0.246 (0.229–0.263) |
| F-beta | 0.701 (0.677–0.724) | 0.603 (0.579–0.628) | 0.596 (0.569–0.620) | 0.723 (0.702–0.745) |
| MCC | 0.490 (0.454–0.524) | 0.307 (0.271–0.346) | 0.357 (0.320–0.393) | 0.519 (0.485–0.553) |
| NPV | 0.618 (0.588–0.646) | 0.536 (0.508–0.565) | 0.492 (0.463–0.519) | 0.645 (0.618–0.674) |
| PPV | 0.810 (0.784–0.835) | 0.691 (0.661–0.719) | 0.755 (0.724–0.786) | 0.821 (0.796–0.847) |
| Sensitivity | 0.618 (0.588–0.646) | 0.536 (0.508–0.565) | 0.492 (0.463–0.519) | 0.645 (0.618–0.674) |
| Specificity | 0.857 (0.836–0.876) | 0.763 (0.739–0.787) | 0.843 (0.823–0.862) | 0.861 (0.842–0.880) |
AUROC – area under the receiver operating characteristic curve, AUPRC – area under the precision–recall curve, LightGBM – light gradient boosting machine, MCC – Matthews correlation coefficient, NPV – negative predictive value, PPV – positive predictive value, XGBoost – eXtreme gradient boosting
*Data are expressed as metric (95% confidence interval) derived from 1000 bootstrap resamples.
Bootstrap validation with 1000 resamples confirmed the consistent superiority of the XGBoost model, as seen from the distributions of receiver operating characteristic (ROC), AUROC, and area under the precision-recall curve with 95% CIs (Figure S4 in the Online Supplementary Document). The calibration curves for both the testing set and validation set showed excellent agreement between predicted probabilities and observed outcomes across the entire risk spectrum (Figure S5 in the Online Supplementary Document). The decision curve analysis plot showed that the prediction model yielded a superior net benefit in both the testing utility (Figure S6 in the Online Supplementary Document).
Model interpretation
Within the global interpretation of the XGBoost model (Figure 2, Panels A and B, birth length emerged as the most influential feature, followed in order by paternal BMI, maternal BMI, sleep duration, exercise time, maternal childbearing age, birth weight, delivery mode, gestational age, paternal childbearing age, timing of solid food introduction, asthma history, maternal education attainment, food/drug allergy history, eczema history, and infant feeding method.
Figure 2. Global and local SHAP illustrations under the optimised XGBoost model. Panel A. SHAP importance plot of variables sorted by feature SHAP values in descending order. Panel B. SHAP bee swarm plot sorted by mean |SHAP| values (descending), with point colours indicating raw feature values (yellow = high, purple = low) and horizontal positions showing directional impact on obesity prediction (right = increases likelihood, left = decreases likelihood). Panels C and D. SHAP waterfall plot of features. Panels E and F. SHAP force plot of features. XGBoost – eXtreme Gradient Boosting, SHAP – SHapley Additive exPlanations.

We also established two case-specific interpretations via SHAP analyses that represent individual predictions on the validation cohort (Figure 2, Panels C and F). The first case involved a child with obesity (model output f(x) = 0.969 vs. the population mean of 0.602) with the following characteristics: birth length 48.8 cm, sleep duration 9.11 hours, positive asthma history, maternal BMI 25.6 kg/m2, preterm gestational age, paternal BMI 29 kg/m2, vaginal delivery, formula feeding, maternal education attainment at bachelor’s degree, solid food introduction at 6–9 months, maternal childbearing age 26.1 years, no eczema history, no food/drug allergies, daily exercise time 3.38 hours, birth weight 3188 g, and paternal childbearing age 29.1 years. Positive contributors to obesity risk included birth length, sleep duration, asthma status, maternal BMI, gestational age, paternal BMI, feeding method, maternal age at childbirth, birth weight, and paternal age at childbirth.
The second case involved a child with normal weight (f(x) = 0.224 vs. mean 0.602) with characteristics: sleep duration 12.3 hours, maternal childbearing age 35.7 years, paternal childbearing age 36.7 years, birth length 52 cm, birth weight 3000 g, maternal BMI 26 kg/m2, paternal BMI 26.7 kg/m2, mixed feeding method, daily exercise 3.57 hours, solid food introduction at 6–9 months, vaginal delivery, term gestation, no eczema history, no asthma history, maternal education at high school level or below, and no food/drug allergies. In this case, only maternal BMI, infant feeding method, and maternal education positively influenced obesity risk.
Among the optimal features selected by the optimised XGBoost model for obesity risk prediction, SHAP analyses revealed four common features in the top 10: paternal BMI, maternal BMI, exercise time, and birth weight. Notably, paternal BMI, maternal BMI, and exercise time consistently ranked within the top 5 across all age subgroups (Figure S7 in the Online Supplementary Document). Model performance plateaued after the top nine features, which were therefore retained for downstream analyses (Table 3). Figure S8 in the Online Supplementary Document displays the SHAP dependence plot for all features to facilitate understanding of how single features affected obesity prediction outcomes.
Table 3. Cumulative prediction performance of the optimised XGBoost model for obesity in children and adolescents
| Top 16 features | Cumulative number of top 16 features | Accuracy | F-beta | AUROC |
|---|---|---|---|---|
| Birth length | 1 | 0.672 | 0.752 | 0.698 |
| Paternal BMI | 2 | 0.709 | 0.740 | 0.781 |
| Maternal BMI | 3 | 0.733 | 0.753 | 0.800 |
| Sleep duration | 4 | 0.758 | 0.777 | 0.823 |
| Exercise time | 5 | 0.758 | 0.773 | 0.832 |
| Maternal childbearing age | 6 | 0.769 | 0.783 | 0.840 |
| Birth weight | 7 | 0.768 | 0.782 | 0.838 |
| Delivery mode | 8 | 0.767 | 0.781 | 0.842 |
| Gestational age | 9 | 0.774 | 0.787 | 0.843 |
| Paternal childbearing age | 10 | 0.770 | 0.782 | 0.845 |
| Time to add solid food | 11 | 0.771 | 0.783 | 0.848 |
| Asthma | 12 | 0.767 | 0.779 | 0.847 |
| Maternal education | 13 | 0.774 | 0.784 | 0.849 |
| Food/drug allergy | 14 | 0.771 | 0.782 | 0.849 |
| Eczema | 15 | 0.775 | 0.785 | 0.849 |
| Infant feeding method | 16 | 0.770 | 0.780 | 0.847 |
AUROC – area under the receiver operating characteristic curve, BMI – body mass index, XGBoost – eXtreme gradient boosting
Model application
The online tool, based on the optimised XGBoost model and its key feature selection, offers two core functions: calculating individualised obesity risk probabilities and visualising feature importance via SHAP value analysis (Figure 3). Its interface comprises a left-hand input section for personal parameters and a right-hand output section that displays the risk assessment via a water balloon visualisation. The tool is now available for public use [27].
Figure 3. Deployment of an online prediction tool for obesity in children and adolescents under the optimised XGBoost model. Panel A. Estimated probabilities of obesity in children and adolescents under the optimised XGBoost model based on input features. Panel B. SHAP values of input features under the optimised XGBoost model based on input features. BMI – body mass index, SHAP – SHapley Additive exPlanations, XGBoost – eXtreme gradient boosting.

In a representative case that demonstrates the model’s utility to quantify obesity risk and deliver interpretable outputs, an individual with a birth length 48 cm, birth weight 3500 g, caesarean delivery, post-term gestation; maternal BMI 28 kg/m2, paternal BMI 28 kg/m2, maternal age at delivery 26 years, sleep duration of six hours per day, and physical activity 0.5 hours per day was estimated to have an 80% obesity risk. The model output (f(x) = 0.802) was substantially higher than the population mean of 0.451. Key positive contributors to the elevated risk included higher maternal and paternal BMI, post-term gestational age, caesarean delivery, shorter sleep duration, higher birth weight, and lower daily exercise time.
DISCUSSION
We sought to develop an interpretable obesity prediction model for children and adolescents aged 2–18 years from Beijing and Tangshan, China, by comparing three ensemble ML models with conventional logistic regression. Using a large-scale native Beijing cohort with rigorous external validation in Tangshan, the optimised XGBoost model exhibited superior predictive performance. We further deployed the model within an interactive web application to facilitate its use in clinical contexts. The model’s innovation lies in two core aspects: it is grounded in region-specific Chinese paediatric data, ensuring alignment with local growth patterns, and its integrated SHAP analysis transforms it into an interpretable decision-support system. Taken together, this enables individualised risk factor decomposition to guide targeted interventions in clinical practice.
Obesity has become increasingly prevalent across all age groups, including children or adolescents and adults. Childhood obesity, for example, often persists into adulthood [28,29], making the elucidation of its underlying determinants a priority task that, despite existing research, still needs to be tackled. A major limitation in delineating robust risk profiles stems from statistical methodology – an area which is now being revolutionised by advances in artificial intelligence, which offers enhanced diagnostic precision and clinical decision-making capacity. Building on prior research using conventional analytical methods, our work surpasses traditional logistic regression approaches by implementing three robust ensemble ML models to better capture complex, nonlinear relationships among risk factors.
Our XGBoost model outperforms other models in external validation, achieving the highest AUROC (0.875) and competitive accuracy (0.754). The XGBoost has emerged as a cornerstone of clinical prediction modelling, including for obesity risk stratification, due to its robust regularisation to mitigate overfitting, scalable parallel computing efficiency, resilience to missing and sparse data, and inherent interpretability potentials [30–34].
To address the ‘black box’ challenge of ML, we integrated SHAP analysis, which quantifies global feature importance while enabling granular interpretation of individual predictions. This approach clarifies how specific feature combinations drive model outputs for each child or adolescent, bridging algorithmic complexity with clinically actionable insights. To translate these findings into practice, we developed an interactive web-based tool that computes individualised obesity risk probabilities in real time. User-input feature values generate instantaneous risk predictions alongside localised SHAP-driven visualisations, empowering clinicians and researchers with data-driven, interpretable decision support.
Our XGBoost model identified a hierarchical set of features for childhood obesity: birth length emerged as the most salient contributor, followed by parental BMI (paternal and maternal), lifestyles (sleep duration, exercise time), and perinatal determinants (birth weight, delivery mode, gestational age). The prominence of parental BMI as a high-level predictor strongly reinforces the well-established relationship between inherited predisposition and shared familial environments in obesity pathogenesis [35,36]. From a biological perspective, it reflects the transmission of obesity-susceptible genes (e.g. FTO, MC4R) that regulate energy homeostasis, appetite control, and adipocyte differentiation [37,38]. These genetic variants increase a child’s inherent adiposity risk and enhance sensitivity to obesogenic environments. Epidemiological evidence shows that children with one parent with obesity face a threefold higher adulthood obesity risk, escalating tenfold if both parents are obese [39].
In terms of lifestyle factors, inadequate sleep and reduced exercise time compound obesity risk by disrupting metabolic regulation and energy balance [19,40–43]. Sleep deprivation dysregulates hypothalamic-pituitary-adrenal axis function, altering leptin and ghrelin levels to increase appetite and energy intake [44,45]. Additionally, insufficient sleep exacerbates fatigue, reducing spontaneous physical activity and promoting sedentary behaviours. Perinatal variables (birth length, weight, gestational age, delivery mode, infant feeding method) may reflect foetal programming effects, where intrauterine growth patterns predispose to later adiposity [46,47]. For example, infants with longer birth lengths (often linked to intrauterine overgrowth) have reduced insulin sensitivity and blunted leptin responses in early childhood – adaptations favouring energy storage. This aligns with prior studies showing that large-for-gestational-age infants (often with longer birth lengths) are at an increased risk of obesity, distinct from small-for-gestational-age infants who develop obesity via catch-up growth [48,49]. Thus, birth length serves as a marker of intrauterine metabolic programming, shaping long-term obesity trajectories.
Maternal age at delivery and educational attainment may act as proxies for socioeconomic circumstances and caregiving environments, which in turn affect children’s dietary patterns and physical activity behaviours. To address this potential relation, we employed restricted cubic spline models within logistic regression to identify optimal threshold values. Existing evidence suggests that suboptimal reproductive age may exacerbate paediatric adiposity risk [50]. Our logistic regression identified a nonlinear association between parental age and offspring obesity risk, peaking at paternal ages of 24–30 years and maternal ages of 23–28 years, with subsequently diminishing risk at more advanced reproductive ages. Less prominent, but clinically relevant factors (asthma, eczema, allergy history) suggest immune-metabolic crosstalk, warranting further mechanistic exploration [20,21,51].
Our subgroup analyses revealed that parental BMI and exercise time maintained consistent predictive value across all age groups, underscoring their fundamental role in obesity risk assessment. This consistence highlights that inherited predisposition (reflected by parental BMI) and modifiable lifestyle factors (particularly physical activity) exert enduring influences throughout childhood development. The shared predictive significance of birth weight across models further reinforces the importance of early-life determinants in shaping long-term obesity trajectories. Collectively, these findings indicate a need for early-life interventions targeting modifiable determinants, while acknowledging immutable risks to stratify high-risk cohorts.
Lastly, the deployed web tool can be integrated easily into child healthcare workflows, such as to early risk identification during annual kindergarten/school entrance health examinations to guide school-family collaborative interventions, as well as in rapid risk stratification during routine community child health clinic visits, enabling referral of high-risk children to specialists. All features (e.g. birth parameters, parental BMI, lifestyle factors) we identified here are routinely collected during standard well-child visits or via simple questionnaires, meaning they require no additional or expensive tests and can be feasibly gathered in primary care settings. The tool’s usability is, therefore, further supported by its extremely low marginal cost and high potential for targeted prevention, but also by its SHAP-enabled interpretability, which can facilitate communication between healthcare providers and families by clarifying the ‘why’ behind the childhood obesity risk. Our future work will include usability testing and a prospective, cluster-randomised controlled trial to rigorously evaluate the tool’s real-world impact on clinical decision-making, patient behaviours, and childhood obesity incidence.
Limitations
Several limitations should be considered when interpreting our findings. First, although BMI serves as a widely accepted metric for assessing nutritional status, as endorsed by the WHO, alternative anthropometric indices, such as waist-to-hip ratio, waist-to-height ratio, and the body roundness index, may more precisely estimate adiposity distribution. However, waist and hip circumference measurements were unavailable in our dataset. Second, childhood weight status is influenced by complex interactions of multiple features. The lack of biochemical or physiological markers prevented us from exploring any mediating pathways and underlying biochemical mechanisms. Third, our study population included only children and adolescents from Beijing and Tangshan, limiting the generalisability of our findings. Future work could explore calibration transfer techniques to adapt the model to new populations and semi-supervised learning to leverage abundant unlabelled data from new regions, reducing dependency on large fully annotated external datasets. Fourth, the cross-sectional design of our study precludes establishing causal relationships between risk features and childhood obesity. To mitigate this to an extent, we embedded penalised regression (e.g. LASSO regularisation) within ML models to enhance stability and reduce spurious correlations from correlated predictors. Fifth, excluding overweight and underweight children and adolescents enhanced the specificity of normal vs. obese comparisons, but limited the generalisability of our inferences to other groups. Future studies could include all weight status categories to explore continuous risk patterns.
CONCLUSIONS
Our analysis confirms the XGBoost as a superior ensemble learning method for childhood obesity prediction. By identifying key influential features and integrating them into an accessible digital tool, this research bridges the gap between predictive modelling and practical healthcare applications. Our findings not only elucidate obesity risk profiles in Chinese paediatric populations, but also demonstrate the model’s potentials for early identification of high-risk children and adolescents in clinical settings.