

In his seminal work ‘The great escape: health, wealth, and the origins of inequality’, Angus Deaton demonstrated how economic development in a country moving from poverty to a high-income economy positively impacted health and life expectancy [1]. Countries are classified in various income categories in a standardized manner by the World Bank [2]. Deaton’s framework was recently expanded to include the role of alcohol consumption, alcohol control policies, and related factors such as culture or religion [3]. This study attempts to empirically examine some of these processes in the Association of Southeast Asian Nations (ASEAN) region (Figure 1) [4].
Figure 1. Economic development, alcohol consumption, alcohol control policies, and life expectancy: a conceptual model. Adapted from Rehm et al. (published under CC BY-NC-ND 4.0 license), with permission [3]. APC – adult alcohol per capita consumption, GDP-PPP – gross domestic product at purchasing power parity, HED – heavy episodic drinking.
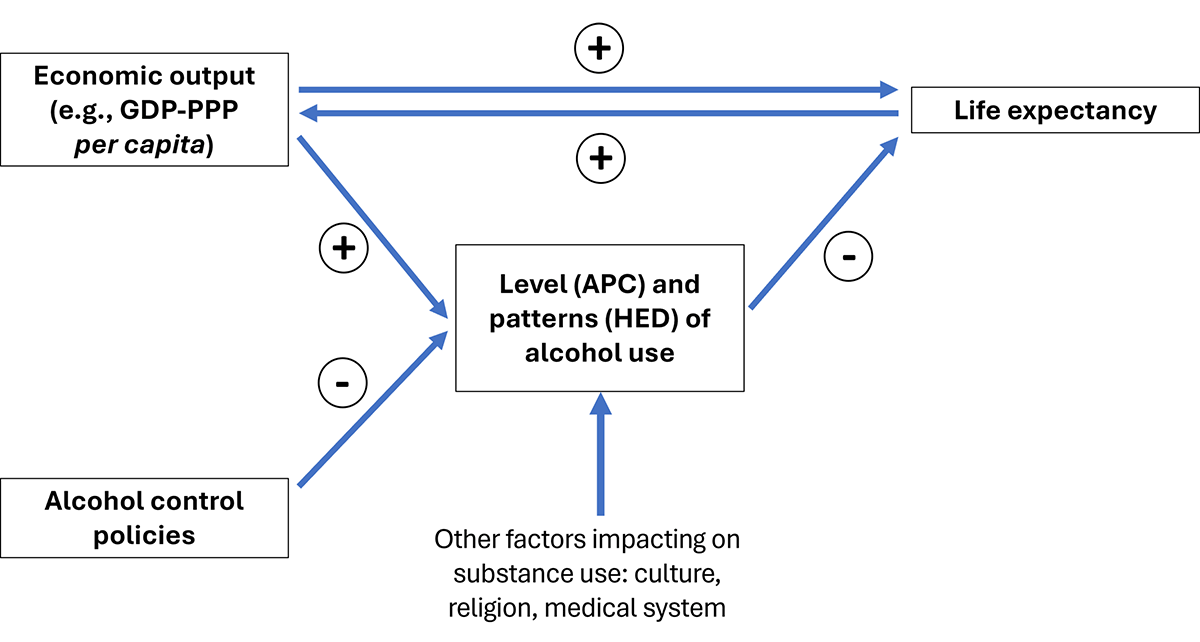
The main independent variable in the model is economic output, which impacts on both the level of alcohol consumption and life expectancy. The former has largely been attributed to increases in purchasing power and the alcohol industry’s intense marketing efforts in low- and middle-income countries with high rates of economic growth [5], while latter results from improved overall living conditions and a reduction in disease and perinatal and infectious causes of death [6]. Finally, alcohol use impacts negatively on life expectancy as a consequence of alcohol-attributable mortality [7,8], which in turn negatively affects economic output [9]. However, the level of alcohol use can be reduced and the patterns (e.g. frequency and temporal distribution of consumption) improved through the implementation of effective alcohol control policies [10,11], and/or by cultural or religious factors (most importantly in Muslim-majority countries [12]).
A first empirical test of the model using all countries in the Western Pacific Region of the World Health Organization (WHO) that transitioned between low- and lower middle-income status between 2000 and 2020 corroborated the main relationships between economic development, level of alcohol consumption, and life expectancy [13], without including alcohol control policies or religion in the model. We will, therefore, include these constructs in this modelling study of ASEAN countries. These ASEAN member states were selected as they have experienced substantial economic growth since 2000, which was associated, as predicted by Deaton [1], with substantial health gains: their economies, on average – as measured by the gross domestic product per capita at purchasing power parity (GDP-PPP; for definition, see Glossary in the Online Supplementary Document) – grew at an annual rate of almost 6% [14], coupled with an annual increase in life expectancy of 0.3% [15]. This means that, on average, their GDP-PPP per capita increased by 18 818 international dollars between 2000 and 2022.
However, it is unclear if the relationship between economic development and life expectancy holds for all countries or if it is influenced by other factors, such as level of alcohol use, alcohol control policies, or religion influence. To explore this question based on the above-specified framework, we attempted to establish an empirically based classification system of countries in the ASEAN region. We hope this system will not only guide future research on the role of alcohol use in different environments, but also assist in the monitoring of the burden attributable to alcohol consumption and the implementation and evaluation of alcohol control policies.
METHODS
We retrieved comparable data for all ASEAN countries for the 2000–2022 period from international organisations such as the World Bank (GDP-PPP per capita, life expectancy), the WHO (adult alcohol per capita consumption (APC); tax rates) and the World Population Review (Appendix S1 in the Online Supplementary Document). Local experts separately retrieved data on alcohol policies from each ASEAN country [16].
Policy analysis
For all countries, we identified the timing of the enactment of the SAFER policies outside of the healthcare system (increases in alcohol excise taxation, availability, and marketing restrictions, drink-driving control) with respect to the economic transition (i.e. before or after the first move in income classification, as per the World Bank, between 2000 and 2022). Similar to recent work on alcohol in the Baltics [17], we then constructed a scale of the potential impact of these policies based on various dimensions (Table S1 and Appendix S2 in the Online Supplementary Document). The scale was restricted to the three ‘best buy’ policies, which were initially recommended by the WHO to cost-effectively reduce the burden of non-communicable disease [18,19], but have been shown to have a wider impact on all-cause mortality and the burden of disease [20,21].
Analysis of religion
Islam is the only major religion that effectively controls alcohol consumption through cultural stigma and legal measures, including outright bans on alcohol consumption [16]. Accordingly, we assigned a religious score of 0.05 for each 1% of the Muslim population within each ASEAN country, which we then combined with the policy score. Specific measures, including Brunei Darussalam’s ban on alcohol sales, are detailed under policy measures in Appendix S2 in the Online Supplementary Document.
Cluster analysis based on trajectories
To explore similarities in temporal trends across countries, we analysed the trajectories of three key variables: APC, GDP-PPP per capita, and life expectancy, from 2000 to 2022 for the 10 ASEAN countries. For each country and variable, we estimated linear trends over time using ordinary least squares regression, through which we extracted three intercepts and three slope coefficients to characterise each trajectory for each country. We then applied hierarchical clustering to the 10 countries using these six coefficients. Euclidean distance was used as the dissimilarity metric, and Ward’s minimum variance method was applied for linkage. We selected this approach over alternative clustering methods because it does not require pre-specification of the number of clusters and allows for easy visual inspection of the resulting dendrogram to guide cluster selection. We determined the number of clusters based on visual inspection of the dendrogram and the elbow method [22].
Other statistical analysis
We fitted generalised least squares (GLS) models to the time series of the three indicators to assess the associations between economic development and life expectancy and APC. This method accounted for autocorrelation in the longitudinal data, which was modelled using a compound symmetry correlation structure. Model adequacy was assessed by inspecting autocorrelation function plots of the normalised residuals.
We estimated two main model specifications: one with APC and another with life expectancy specified as the dependent variable. In both, GDP-PPP was the independent variable, divided by 1000 to improve interpretability of the regression coefficients. We fitted these models separately for different subsets of countries and time periods, including, but not limited to, all 10 ASEAN countries and by clusters. For each fitted model, we evaluated the assumption of normality of residuals using histogram plots. When deviations from normality were observed, the dependent variable was log-transformed prior to refitting the GLS model. We used R, version 4.3.3 (R Core Team, Vienna, Austria) for all statistical analyses.
RESULTS
The first classification of countries
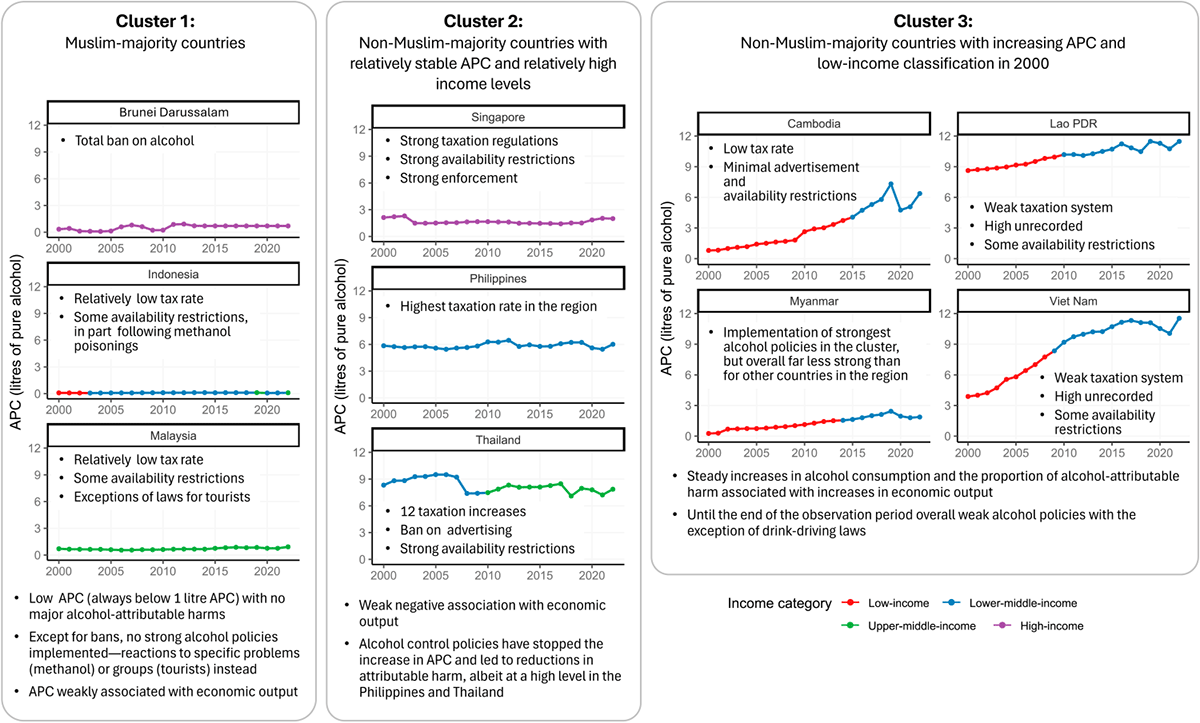
The hierarchical clustering grouped the 10 countries into two main clusters: the first included Brunei Darussalam, Indonesia, Malaysia, Philippines, Singapore, and Thailand, while the second included Cambodia, Lao PDR, Myanmar, and Viet Nam. Countries in the first group were characterised by relatively stable levels of APC, higher GDP-PPP, and higher life expectancy. In contrast, countries in the second group generally showed increasing trends in alcohol consumption alongside lower but increasing levels of GDP-PPP and life expectancy (Appendix S3 in the Online Supplementary Document). While the dendrogram suggested two broad clusters, the elbow method indicated that five clusters would be optimal. This solution would retain the two initial clusters, while identifying Viet Nam, Singapore, and Thailand as distinct, single-country clusters, reflecting their unique trajectories for some of the indicators being tracked. However, opting for this solution would lead to losing the ability to compare countries within clusters for the three clusters containing only one country. Following the identification of two main clusters, we separated the Muslim-majority countries from the first category due to their consistently low APC levels (Appendix S3 in the Online Supplementary Document). We thereby arrived at three groups of countries for further analyses (Appendix S4 in the Online Supplementary Document):
− cluster 1 (Muslim-majority countries): Brunei Darussalam, Indonesia, and Malaysia. These countries maintained an APC lower than 1 L pure alcohol throughout the entire time period examined.
− cluster 2 (non-Muslim-majority countries): the Philippines, Singapore, and Thailand. These nations are characterised by relatively stable APCs and high income levels.
− cluster 3 (non-Muslim-majority countries): Cambodia, Lao PDR, Myanmar, and Viet Nam. These countries showed increasing APCs and held a low-income classification in 2000.
An overview of country characteristics by these clusters can be found in Table 1.
Table 1. Religion, economic characteristics, and alcohol consumption of 10 ASEAN countries
APC – alcohol per capita consumption, BRN – Brunei Darussalam, GDP-PPP – gross domestic product per capita at purchasing power parity, HIC – high-income country, IDN – Indonesia, KHM – Cambodia, LAO – Lao PDR, LIC – low-income country – LMIC – lower middle-income country, MMR – Myanmar, MYS – Malaysia, PHL – Philippines, SGP – Singapore, THA – Thailand, UMIC – upper middle-income country, VNM – Viet Nam
The association between economic development and life expectancy
There was a consistent positive association between GDP-PPP and life expectancy at birth (Appendix S5 in the Online Supplementary Document). However, the association was stronger during periods when the countries were at lower income levels. Few differences in the strength of the association between the three clusters of countries were evident.
These descriptive results were corroborated by the regression analyses (Table 2). Specifically, an increase of international USD 1000 was associated with a 2.8-year gain in life expectancy for the low-income group, compared to only 0.05 years for the high-income group (average increase of about 0.13 years).
Table 2. Association of GDP-PPP per capita (in 1000 international dollars) with life expectancy and APC in ASEAN countries from 2000–2022, during periods of different income levels and by cluster
APC – alcohol per capita consumption, ASEAN – Association of Southeast Asian Nations, CI – confidence interval, GDP-PPP – gross domestic product per capita at purchasing power parity, HIC – high-income countries, LIC – lower income country, LMIC – lower middle-income country, UMIC – upper-middle income country
*Cluster 1: Brunei Darussalam, Indonesia, and Malaysia. Cluster 2: Philippines, Singapore, and Thailand. Cluster 3: Cambodia, Lao PDR, Myanmar, and Viet Nam.
†The outcome (life expectancy or APC) was log-transformed.
The association between economic development and APC
We found no clear and consistent associations between economic development and APC. While there was an overall inverse relationship for all ASEAN countries, the countries in cluster 3, which started in the year 2000 in the low-income category, showed increases of 19% in APC associated with increases of international USD 1000 in GDP-PPP per capita (Table 2; Appendix S5 in the Online Supplementary Document).
The association between alcohol control policies and alcohol consumption levels
Overall, a clear cluster-specific pattern of policy enactments emerges from our analysis of alcohol control policies and the related scoring and ranking based on scales reflecting enacted policies and religious factors (Table 3; Tables S1–3 in the Online Supplementary Document). Among Muslim-majority countries (cluster 1), Indonesia and Malaysia rely primarily on the informal control inherent in religious beliefs, whereas Brunei Darussalam has implemented a ban on alcohol sales. Consequently, Brunei Darussalam ranks first among 10 ASEAN nations, while Malaysia and Indonesia rank seventh and ninth, respectively. However, when combining policy scores with religious factors (percentage of Muslim population), these three countries rank as the top three for alcohol control, as overall the level of APC remained under 1 L, considerably below the global [23] or regional averages.
Table 3. Scores and ranking of alcohol control policies, religious factors, and APC changes for 10 ASEAN countries in 2000–2022
APC – alcohol per capita consumption, ASEAN – Association of Southeast Asian Nations, BRN – Brunei Darussalam, IDN – Indonesia, KHM – Cambodia, LAO – Lao PDR, MMR – Myanmar, MYS – Malaysia, PHL – Philippines, SGP – Singapore, THA – Thailand, VNM – Viet Nam
*Code drawn from Table S1 in the Online Supplementary Document.
†Data drawn from Table 1.
As for cluster 3 – comprising countries with low-income levels in 2000 (Cambodia, Lao PDR, Myanmar, and Viet Nam) – only relatively weak policies were implemented relatively late in the transition, and no cultural or other factors seem to have impacted the rising APC trends until 2019. In 2019 and 2020, consumption temporarily decreased due to new policy implementations and the COVID-19 pandemic, respectively. Cluster 2, which included countries that were lower middle-income or higher in 2000 (the Philippines, Singapore, Thailand), seem to have implemented more effective alcohol control policies earlier and consequently experienced fairly stable consumption levels. Among the 10 ASEAN countries, cluster 3 countries ranked seventh to tenth based on the combined scores of the policy and religious factors, while cluster 2 countries occupied the fourth, fifth, and sixth ranks.
Overall, when religion and policy factors are taken together, the countries align perfectly in the clusters. Cluster 1 can be characterised by the overall lowest level of consumption, even though some relative increases were seen (ranked first to third overall). Cluster 2 is characterised by overall successful efforts to halt further increases of APC, albeit at different levels, with Thailand ranking significantly above the global average, the Philippines slightly above, and Singapore clearly below (countries ranked fourth to sixth overall). Finally, cluster 3 experienced increases due to not implementing a sufficiently strong set of policies to stop the increase in alcohol consumption (ranked seventh to tenth overall). It should be noted that within cluster 3, Myanmar, the country with the relatively strongest policies, clearly had a slower trajectory in increasing alcohol consumption (Figure 2, Table 3).
Figure 2. Summary results for the three country clusters. APC – adult alcohol per capita consumption.
DISCUSSION
While we found overall confirmation for the conceptual model on the impact of economic development on health and alcohol use, we summarise current knowledge based on the experience of ASEAN countries as follows. Economic development was associated with increases in life expectancy, with the main effects occurring during the phase of lower income. This means that the higher the economic development, the lower the average gain in life expectancy per unit increase of GDP-PPP per capita. With respect to the association with APC, as postulated, alcohol control policies and culture or religion – in the case of ASEAN member states, Islam – were associated with slowing or halting the impact of economic development on alcohol consumption. Without either of these factors, there seem to be uncontrolled increases in alcohol consumption, which in the case of ASEAN member states were only stopped during the COVID-19 pandemic. As the level of alcohol consumption is one of the main contributors to alcohol-attributable mortality [24], uninterrupted and uncontrolled increases in APC will likely lead to decreases in life expectancy [13].
Before discussing the implications of these findings, we must acknowledge the limitations of our approach. First, we have examined trends in ecological data to set up a classification for the subsequent analyses. However, we cannot establish causality based on the current analyses alone; further analyses with a higher degree of statistical control are necessary to rule out potential alternative explanations [21,25]. Second, we have not yet established a final methodology to estimate the impact of APC on life expectancy, even though alcohol consumption is associated with lower life expectancy through premature alcohol-attributable deaths [23,26]. To establish a final methodology, we would need to employ life expectancy tables and incorporate some assumptions regarding competing causes of deaths, as suggested elsewhere [13]. Third, due to the fact that, with only one exception [27], there are no established Asian scales for alcohol control policies to score countries, we constructed an ad hoc scale based on the WHO’s best buys, which appear in all alcohol control policy scores, albeit with different scales or rules for scoring them (Appendix S2 in the Online Supplementary Document). In contrast to the approach used with some scales [28], marketing bans in this study have been scored using half the points allotted to the other two best buys. While there is some evidence for an impact on consumption as a result of marketing restrictions [29,30], a recent systematic review concluded that there is not enough evidence for this type of policy to be considered a best buy [31–33]. Classifying these measures as ‘best buys’ thus remains controversial due to varying effectiveness in reducing consumption [32,34] and the timing of their impact [17,35,36]. Nevertheless, the same classification into clusters would have resulted from us focusing strictly on taxation and availability restrictions alone – the two best buys that are not at all controversial [10,21,37]. Data limitations also persist, particularly in terms of the absence of comparable indicators for policy enforcement. For instance, Myanmar has a 1917 law that serves as a prime example regulating the manufacturing, possession, sale, import, export, and transport of alcohol. There are some doubts as to what degree this law has been enforced in this country, but its current political situation (i.e, country undergoing a civil war marked by economic deterioration, mass displacement, and a severe humanitarian emergency) does not allow for further inquiry. However, even in ASEAN countries without civil conflict, enforcement data for major policies remain spotty and contradictory. However, the extent of unrecorded consumption [38,39], which is collected in a standardised way via the WHO STEPS survey in the region, is available to us [40]. Specifically for Brunei Darussalam, it should be noted that the WHO data on APC was unstable due to its small population size, and the rough methodology based on food balance sheets employed by the Food and Agriculture Organization of the United Nations that provided data estimated up until 2013 [41,42]. The data for the years following 2013 were imputed, which is why the results for this country may be biased.
Despite these limitations, the results supporting this classification method underscore the key roles of alcohol control policy and religion during a country’s economic transition (i.e. we found no other strong cultural factors within ASEAN countries). This result can additionally be corroborated by recent analyses for India [43] and China [44]. In both cases, policies were found to be responsible for halting further increases in APC. In India, this was achieved through the classic best buys of taxation and availability restrictions, including state-level bans [43]; in China, the primary driver was the anti-corruption campaign, though it was not originally intended to target APC [44]. Due to a lack of effective alcohol control policies and the presence of cultural barriers, alcohol consumption seems to have increased steadily to high overall levels. Consequently, Viet Nam and Lao PDR now rank within the top 20 countries for average global consumption [45], exhibiting the expected associated negative consequences in terms of attributable burden of disease and social harm.
Future research on the role of alcohol use in ASEAN countries should be sensitive to the potential impacts of religion and any new alcohol control policies implemented. The enforcement level of these policies should be incorporated not only nationally but also into all global monitoring systems to enable accurate comparisons to be made between countries. Moreover, countries should ideally be compared to countries placed within the same cluster, such as through interrupted time series analyses [21].
CONCLUSIONS
Strong alcohol control policies should be implemented to prevent increases in consumption and attributable harm in countries without cultural or religious barriers to alcohol consumption, so that they can reap the full health benefits of economic development. Without such measures, increases in APC will lead to a decrease in life expectancy, thus slowing down economic development.